
Setting Up TradingView Like a Boss

Get ready, traders! I'm about to take you on an exhilarating journey through TradingView, where you'll learn to navigate this powerhouse like a seasoned pro. This is just the tip of the iceberg; more detailed explorations are coming in follow-up posts. By the end, you'll be ready to trade with the finesse of a market wizard, whether you're starting out or already have some experience under your belt
First off, let's get you set up on your computer.
Create a TradingView Account
Sign Up: Head over to the TradingView website and hit 'Join Now' or 'Sign Up'. It's as easy as pie!
Choose a Plan: You've got a free plan with just enough to get your feet wet, or go pro with paid plans that unlock a treasure trove of tools and banish those pesky ads.
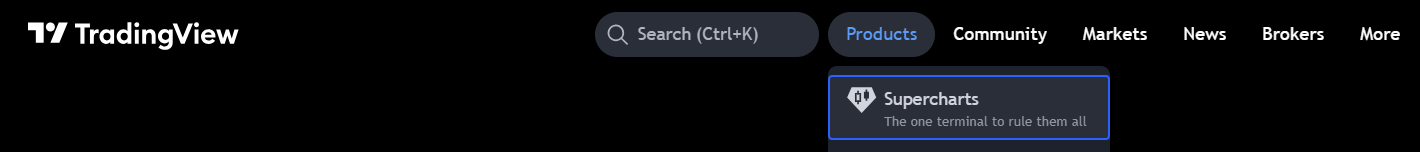
Super Charts: Your Trading Command Centre
You dive into the 'Products' section and click on the 'Super Charts' tab - voilà, your standard chart pops up. This is your new home base for all things trading. Access your profile in the top left, and remember, you can always zip back to this page by clicking the 'Home' tab under your profile.
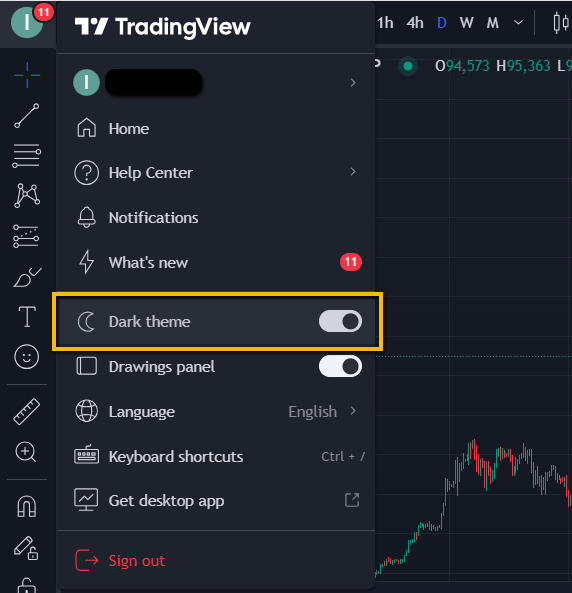
Theme Mode Magic
Customize your visual vibes by heading into 'App Settings' for theme selection. Do you love the soothing darkness of night trading or prefer the crispness of light mode? Set it to match your mood or your system's theme, but I'm all for dark mode - it's like trading under the stars!
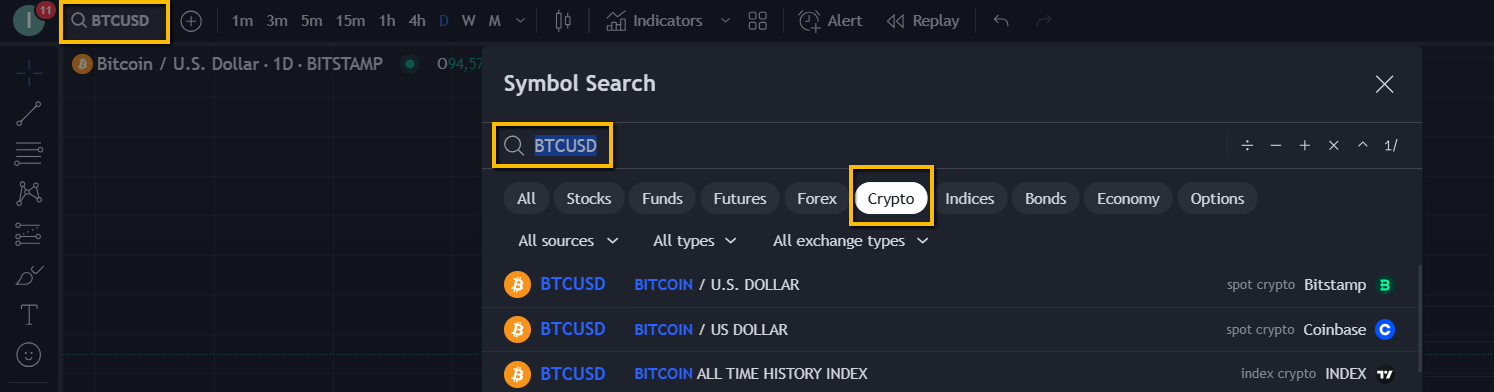
Main Menu Mastery
This is where the magic happens - your main chart for dissecting market data. With a few clicks, you can switch from stocks to crypto; type in 'Bitcoin', tap it, and boom, you're staring at Bitcoin's chart, ready to analyse.
On the menu, you can select which trading pair or asset you want to look at.
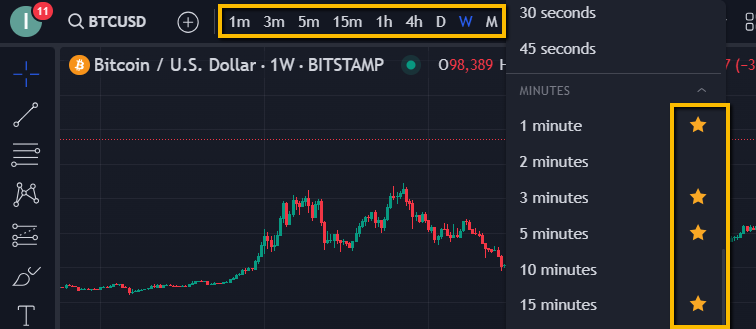
Timeframes
Adjust those timeframes with ease. Candlesticks showing weeks? Daily views? Or do you want to dive into the minute-by-minute action of day trading? Star your favourite timeframes for quick access. I've got my list from 1-minute to monthly intervals, tailored just how I like it.
Display options: Chart Your Style
Decide how you want your data displayed. Candlesticks are just the beginning; there's a whole menu of visual delights to explore.

Indicators: Your Market GPS
The Indicators tab is your treasure map to market trends. We'll dive deeper into these navigational tools soon, but for now, know that this is where your journey to market foresight begins.
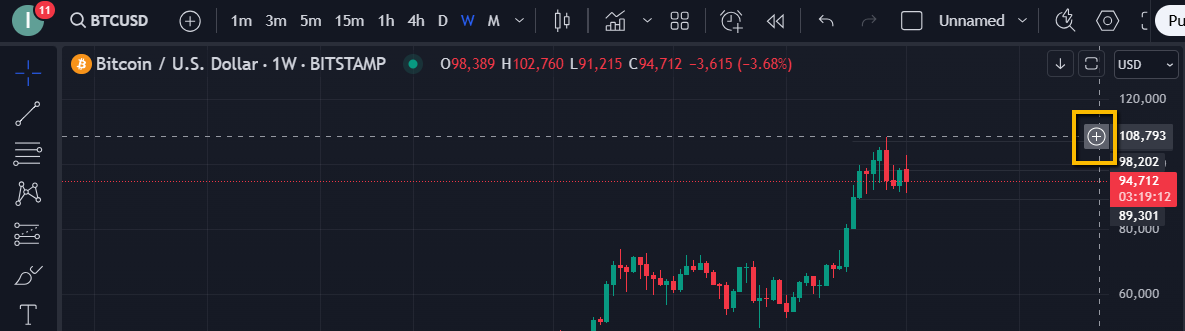
Alerts: Your Market Watchdog
Set your alerts like traps waiting to spring. Want to know when Bitcoin soars to new heights? Set an alert, and when that price level is hit, you'll be the first to know. Customize your alerts for the perfect heads-up.
For instance, if you want an alert when BTC hits an all-time high, hover your cursor to that price level, click the plus sign, and select 'Add Alert'. A dotted line will appear, and by double-clicking it, you can customize the alert's message, name, and other details.
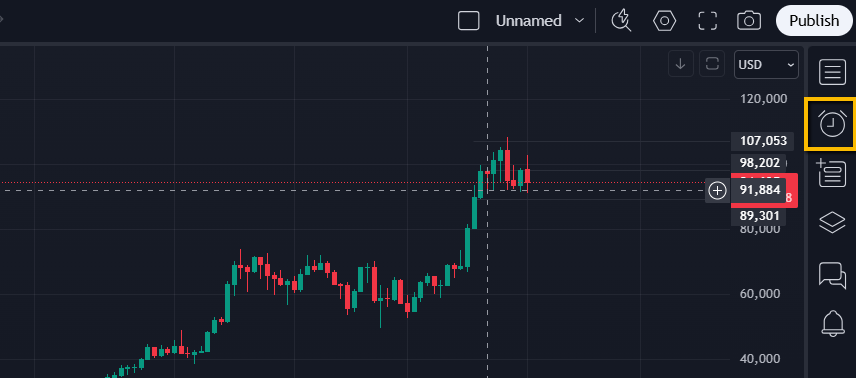
Once saved, you can manage all your alerts from here.
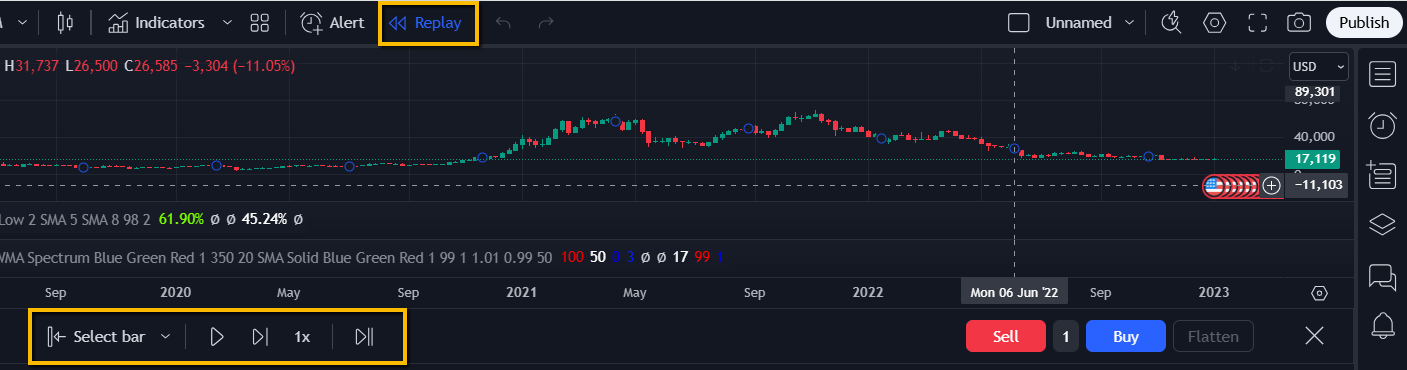
Bar Replay: Time Travel Trading
Imagine testing your trading strategies in a time machine. That's Bar Replay for you - practice without the real-time pressure. Adjust speeds, jump to specific dates, or play it randomly. It's like having a personal trading dojo.
With 'Bar Replay', you can adjust the speed from one candle per second up to ten. You can also jump to specific dates or random bars to keep your practice sessions fresh and challenging. You can click on the drop-down arrow on the ‘Select bar’ tab to do this.
Quick Tips for Chart Whizzes: Double-click the vertical axis if you ever lose your chart in the timeline, and drag sideways to zoom in or out on your market journey.
Practice Makes Perfect: Use the buy and sell buttons to simulate trades, sharpening your skills without the stakes.
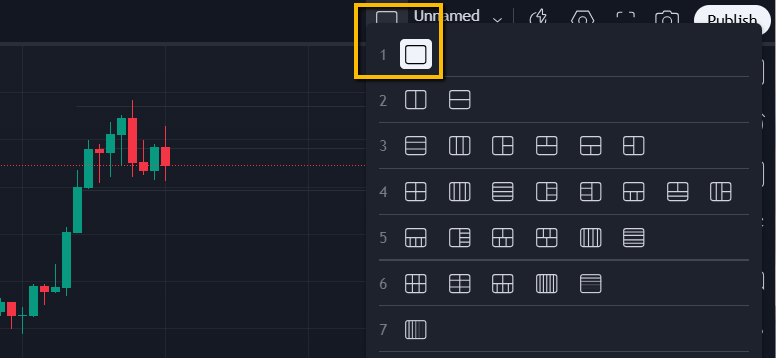
Layout: Multi-Timeframe Mastery
Your TradingView subscription tier determines your layout options. Set up multiple charts, sync them, or mix and match timeframes and symbols. It's like having several screens in one, making multi-timeframe analysis a breeze.
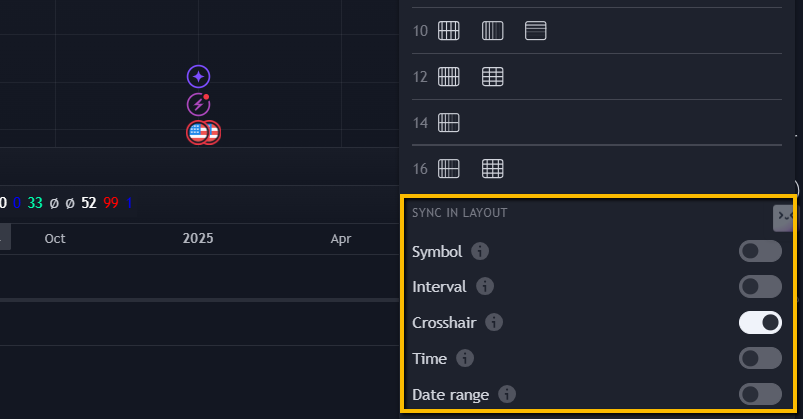
The synchronization menu allows you to align all charts to the same asset and timeframe or customize each one independently. If you uncheck the 'Interval' lock, you can have one chart showing BTC on a 5-minute timeframe while another shows it on a 15-minute timeframe. Unchecking the 'Symbol' lock lets you compare different assets like BTC and Ethereum.
Disabling 'Crosshairs' isolates the cursor to a single chart, and unchecking 'Date Range' allows independent scrolling of each chart's timeline.
Save & Conquer
Save your custom layouts for instant recall, ensuring your setup is always just a click away.
Click on the layout name next to the layout tab, then click 'Save Layout', rename it, and you can recall it anytime. This setup helps in managing different indicators or trading strategies efficiently.
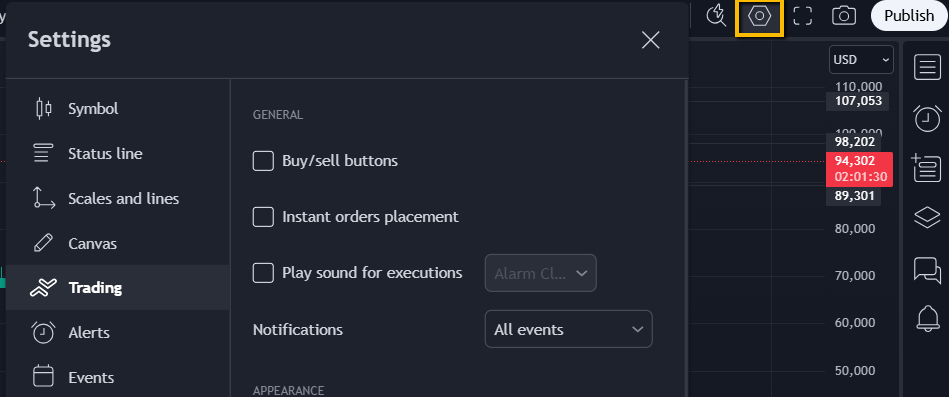
Settings: Your Chart's Personality
Tweak everything from candle colours to what data you see. Make your charts work for you, not the other way around.
The settings button gives us total control over customizing our main charting layout. You can decide the color of candles, what information appears on your charts, and the overall color theme.
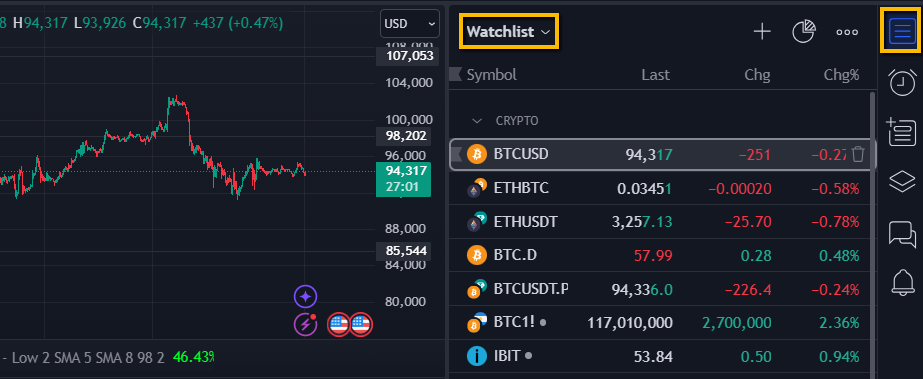
Watchlists: Your Trading Radar
Keep your watchlists organized so you never miss a market move. It's like having a personal assistant for stock watching.
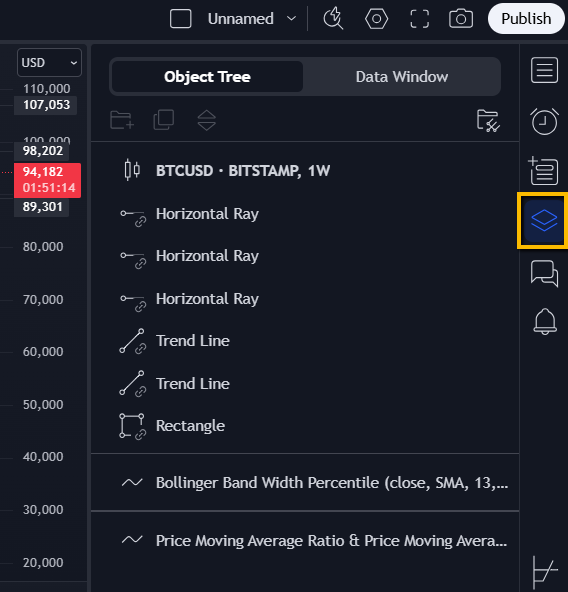
Object Tree and Data Window
Manage your drawings with ease. No more clutter, just clear, actionable insights. The Object Tree and Data Window button tracks any drawings made on your chart, offering a way to manage and organize them for clarity.
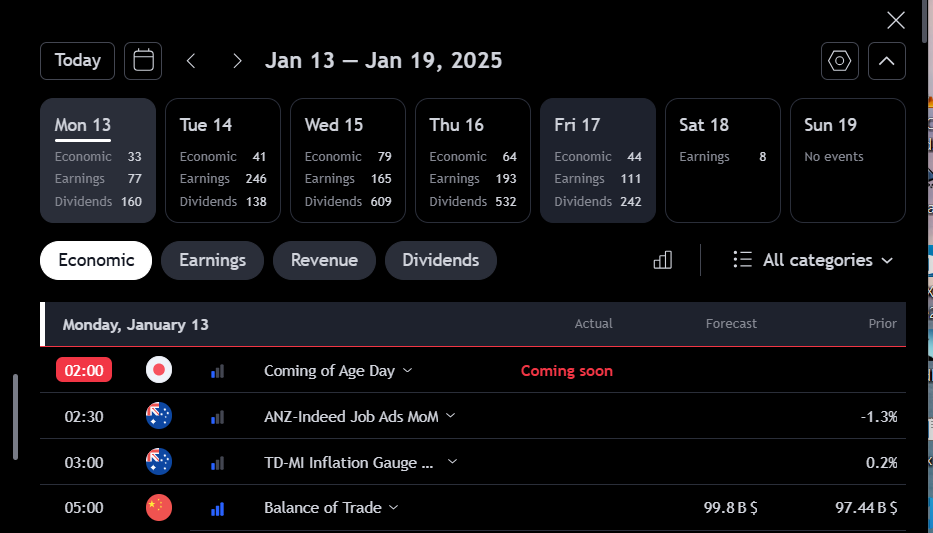
Calendar: Your Market Events Compass
Clicking the economic calendar button brings it up on the side menu. A quick click brings up the economic calendar, ensuring you're always in the loop on market-moving events.
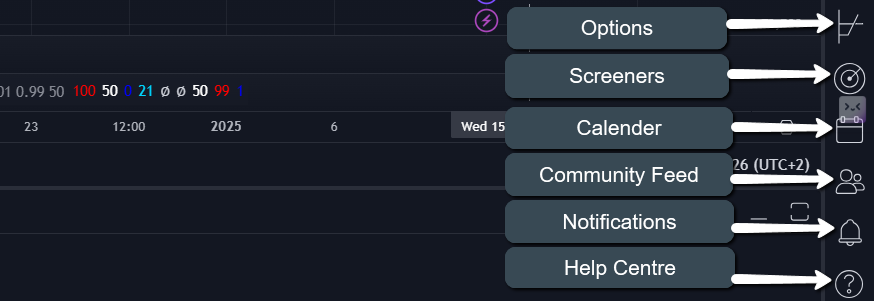
Screeners: Your Data Filter
Decide how you want your numbers - in percentages or raw data. It's all about making your analysis as clear as day.
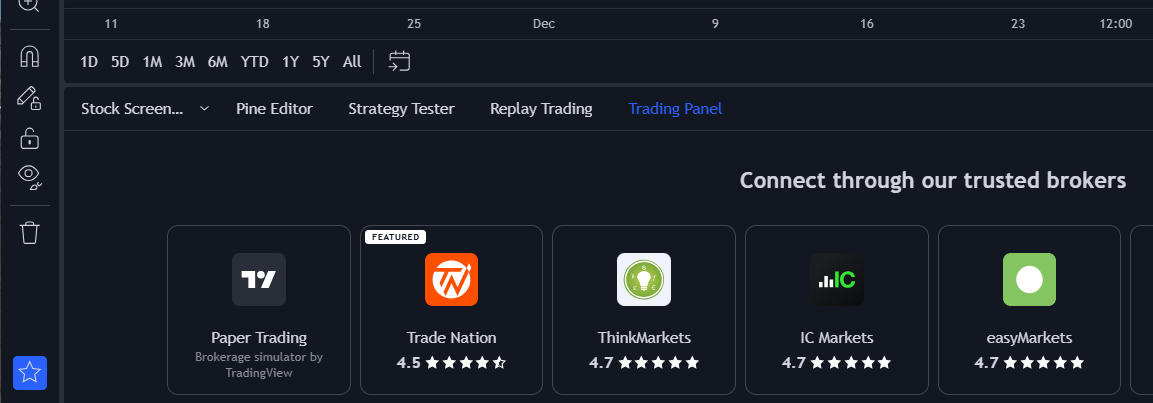
Trading Panel: Your Execution Hub
In the bottom pane you will find your trading panel. Connect to brokers for paper trading, set your trade parameters, and visualize your strategy on the chart. This is where your trading ideas turn into action. Once connected, you can simulate trades, setting take-profit, stop-loss, unit amounts, and entry prices.
And remember, the left side of your chart is your toolkit for indicators and analysis - we'll explore this treasure trove in the next blog. So, buckle up, because your TradingView adventure has only just begun!
🐋 Swim with the Whales
Let's dive into some market wisdom from Captain Kyle:
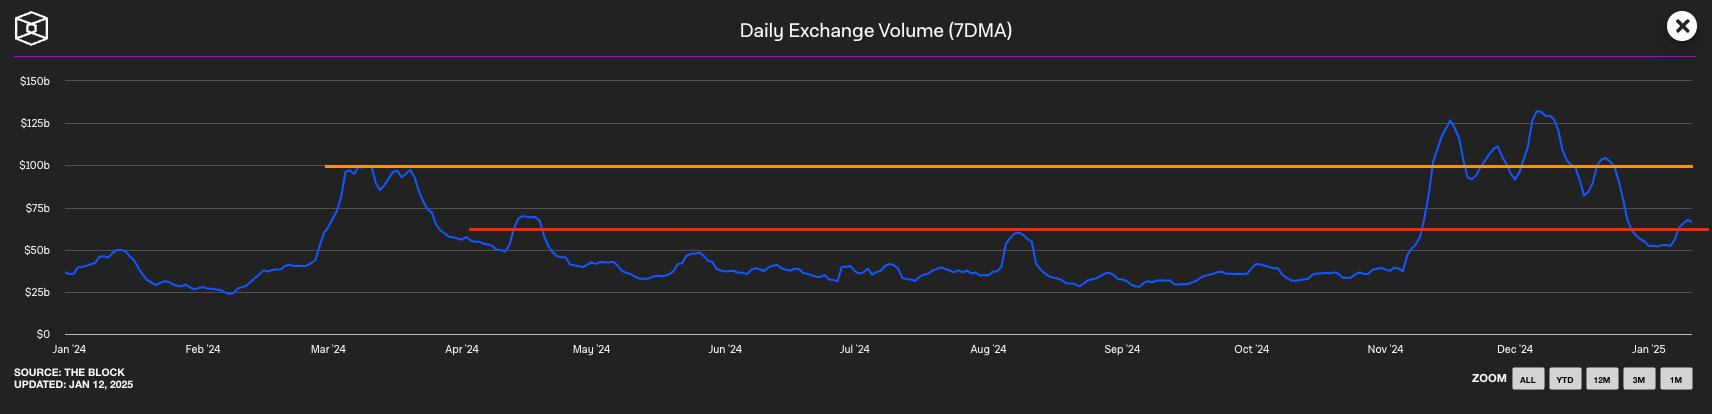
"Still super low volume. From a bullish perspective, it's not looking promising that we're just barely hanging onto the red horizontal. If this turns out to be another lower high, we could be facing an even tougher market. However, the low volume could flip to a bullish scenario if we can keep the price above $91,000."
But remember, in trading, we deal in probabilities, not certainties. Here's another perspective from SeaScalper Farouk:
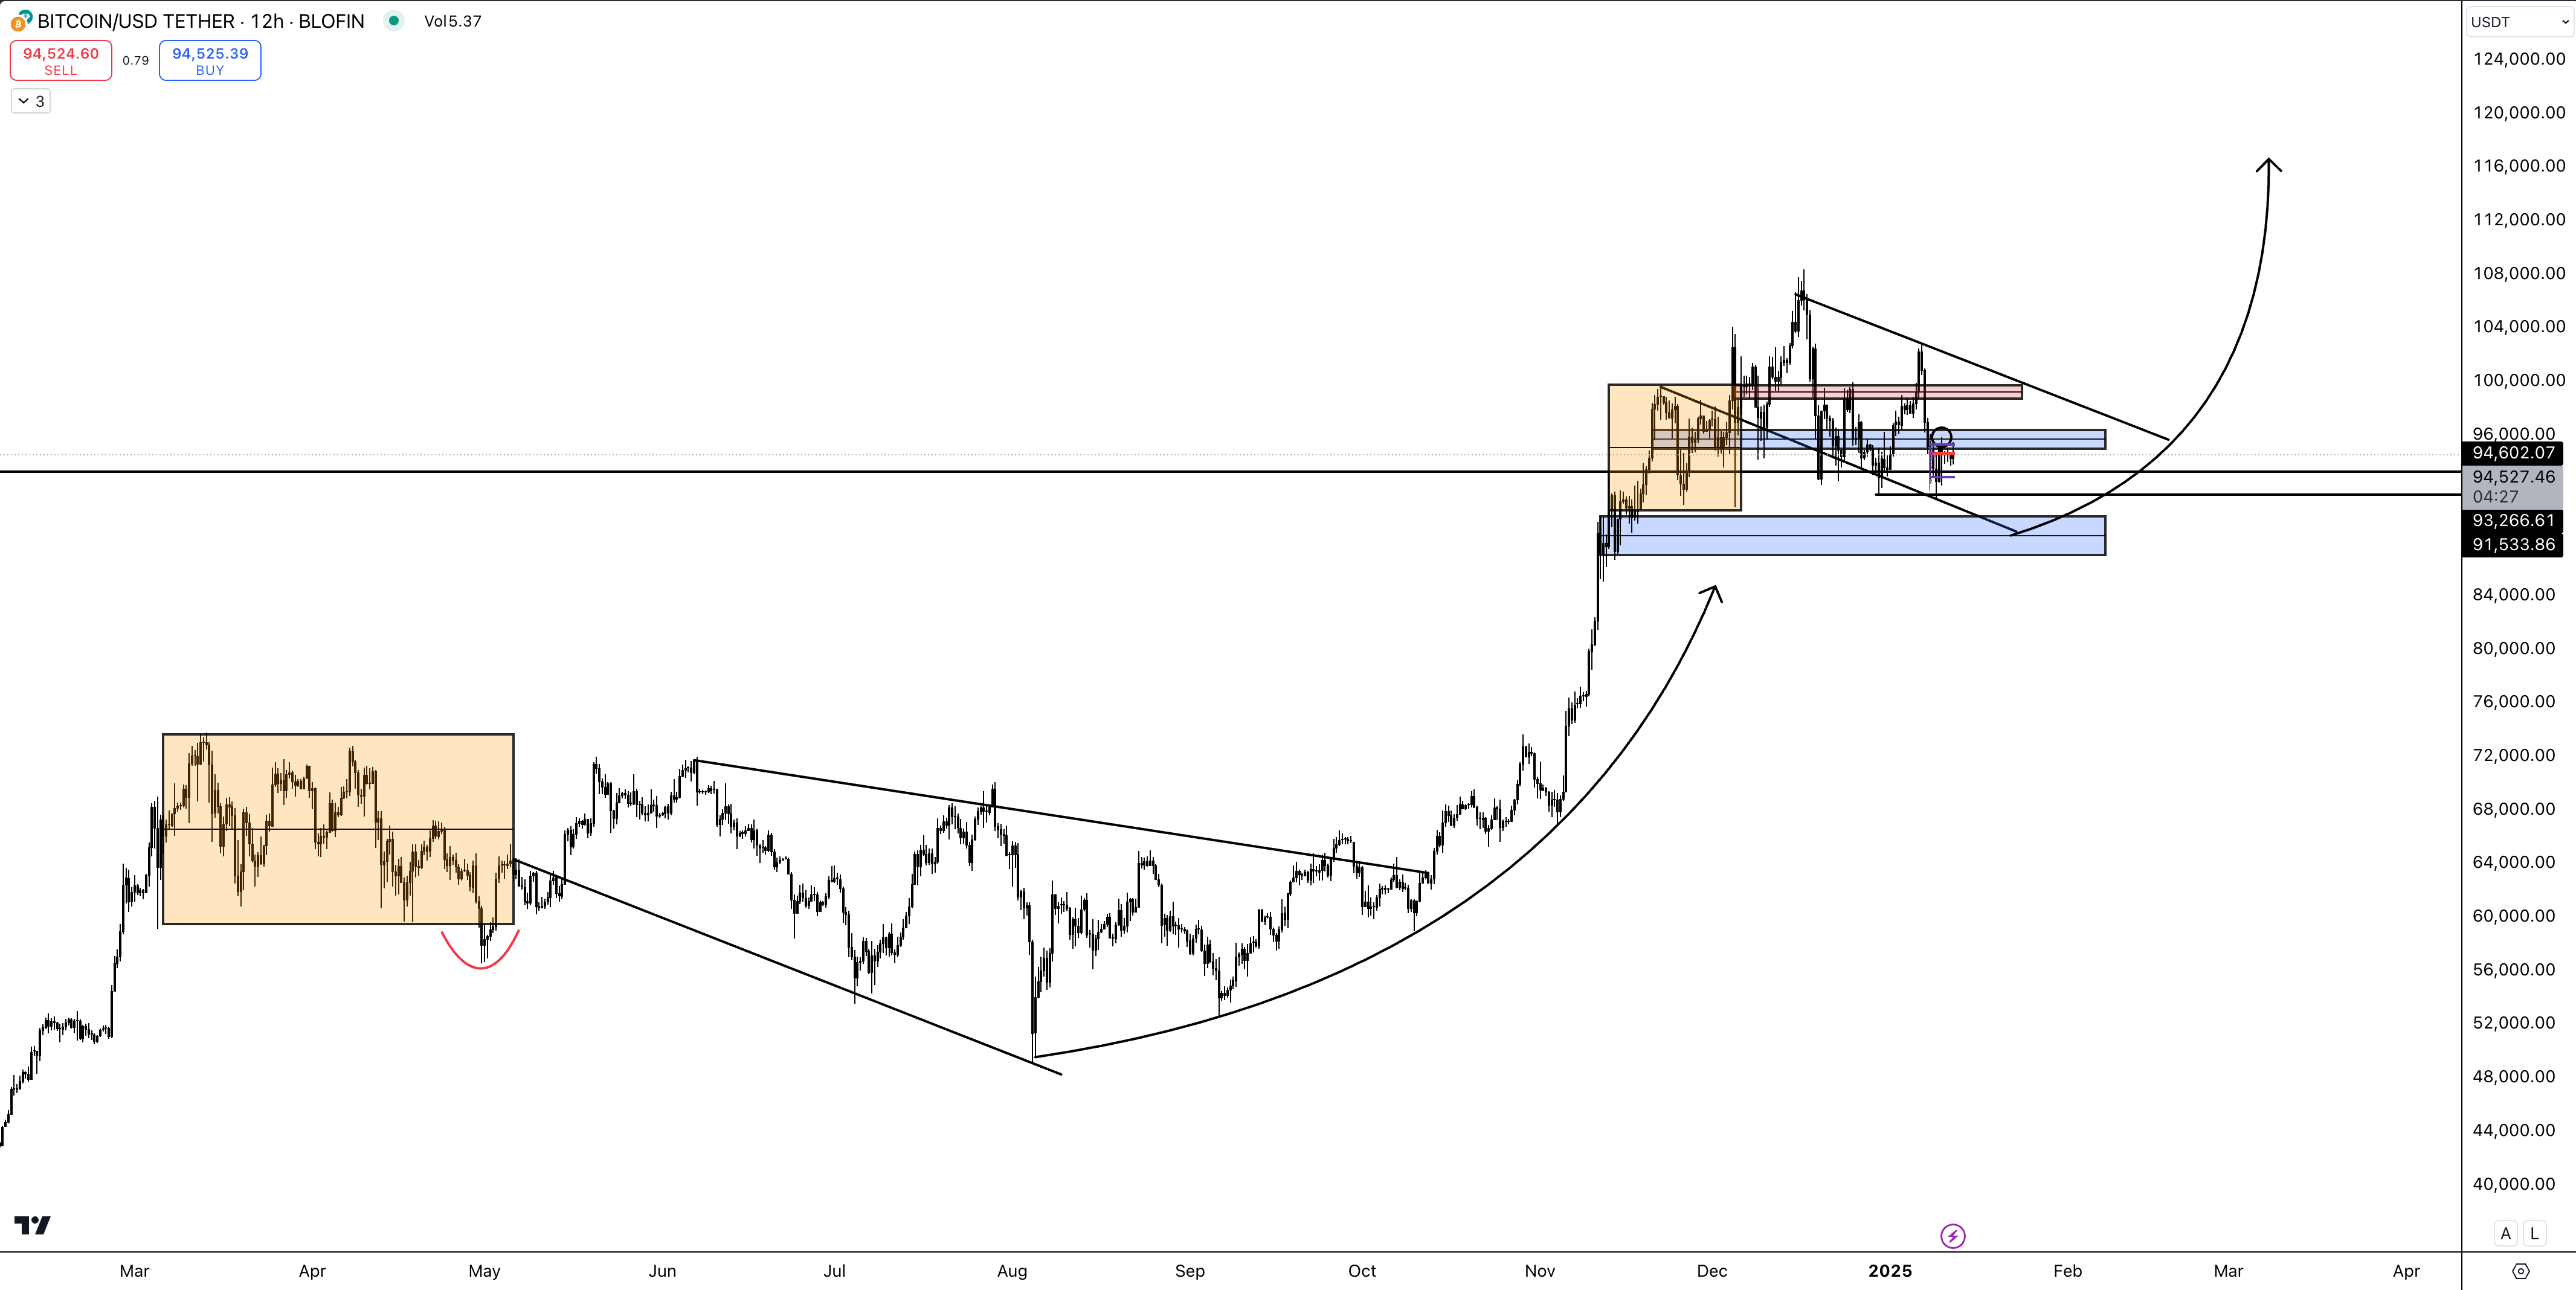
"I have a feeling many are waiting for a 90k sweep. But I think we might just push straight from here to a new all-time high around 115-125k. That could be the peak before a significant drop to 75k. Then, when BTC revisits 90k to clear out those equal lows, it’ll likely crash, trapping late long positions."
Christo Columbus also shared his deep insights on Economic Balance and the pivotal role of Jobs Data. In The Whale Room, we're not just about trading; we're about learning to think critically and independently.
Watch how our Whale Room community transforms these insights into profitable opportunities.
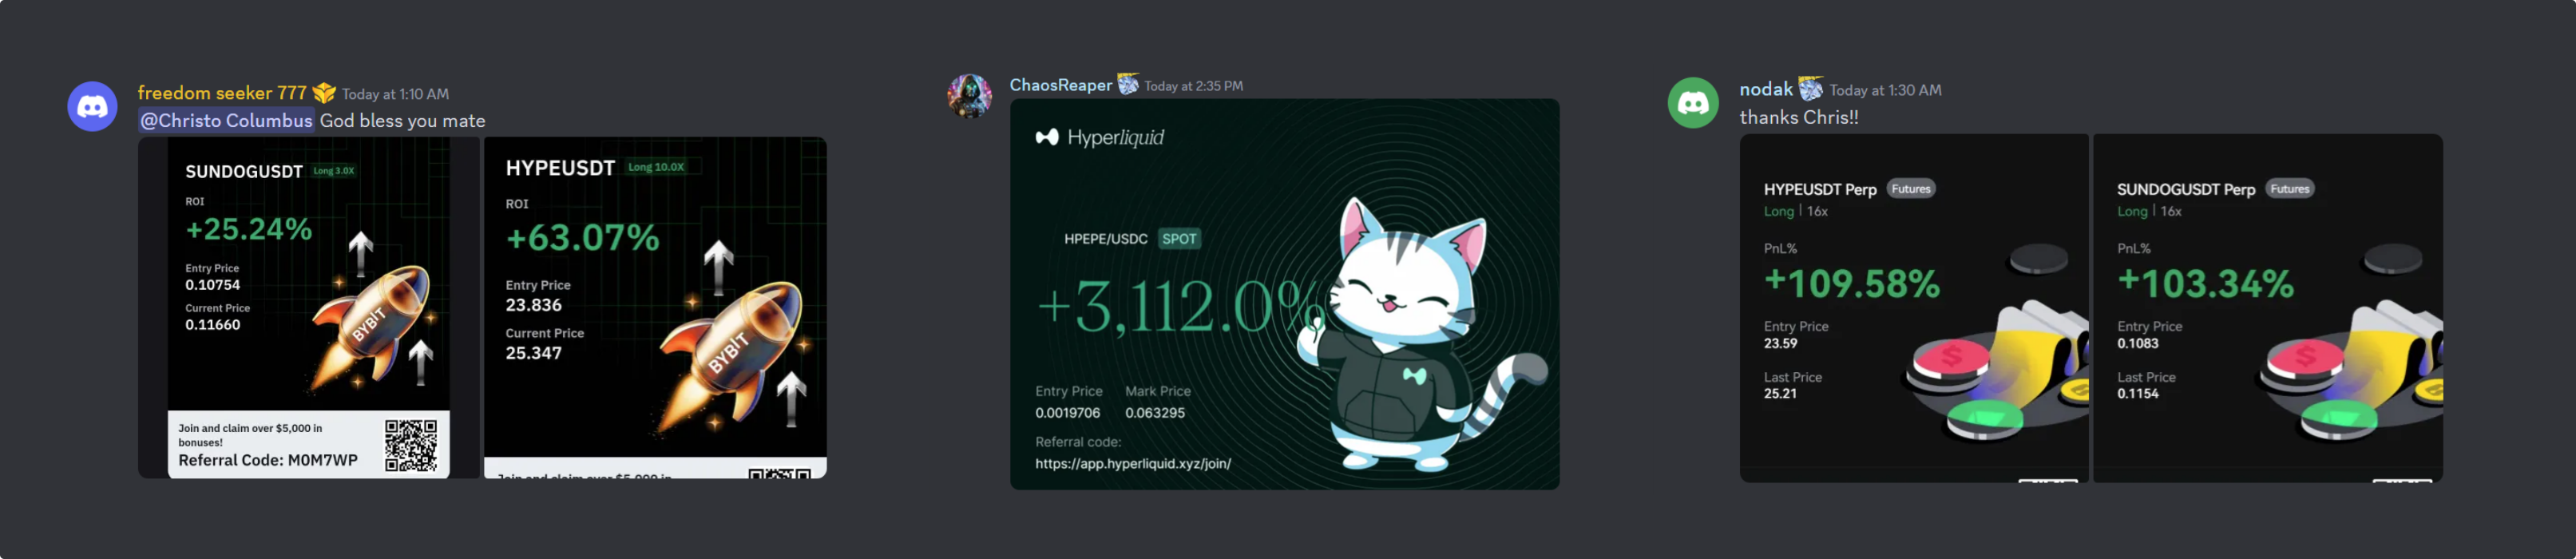
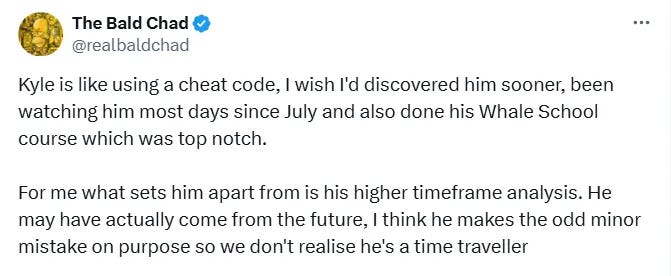
But it's not all about the charts and numbers; it's about steering your investment journey towards success. Here’s what our members say about their transformative experiences in The Whale Room:
Are you ready to join the pod and swim with the whales?

Conclusion
Wow, what a ride! We've just skimmed the surface of TradingView's vast ocean of features, setting you up with the essentials to trade like a pro. From creating your account to mastering chart layouts, setting alerts, and playing with timeframes, you're now equipped with the basics to dive into the markets with confidence.
Remember, becoming a master isn't an overnight quest. This blog is just the beginning of your journey with TradingView. Keep exploring, keep practicing with those Bar Replays, and don't forget to check out the follow-up posts where we'll delve deeper into indicators, strategies, and more advanced techniques.
Playful charts, vibrant themes, and whimsical tools are all there to make your trading experience not just effective but also enjoyable. TradingView isn't just a platform; it's your playground for financial creativity. So go ahead, organize your watchlists, customize your charts to your heart's content, and let your imagination guide your trading strategy.
Stay curious, stay playful, and most importantly, stay profitable. Here's to your success in the dynamic world of trading! Keep those charts fun, your strategies sharp, and your eyes on the prize. Happy trading, and see you on the next adventure!
Did I introduce you to any TradingView features today that you hadn't heard of before? Let me know in the comments below.
We're potentially facing a colossal market upswing, and without the right guidance, you might find your portfolio in the red despite the recent green. Don't risk missing out or worse, messing up your investments. Secure your spot in The Whale Room where you'll learn not just when but how to make strategic entries that can define your trading success. Join the Whale Room today to ride the wave of the next big market move with confidence
Help Spread the Word!
If you’d like to help me spread the word, all you have to do is send one friend a personal email where you tell them all about today’s blog.
Follow Kyle on X: Kyle Doops
Watch Kyle’s YouTube channel: Kyle's YouTube
Follow our new Whale Room page on X: Whale Room X Page
Chat soon!
Your Whale Room Blogger