


Fib Fun: Unlocking TradingView's Secret Levels


Hey there, trading adventurers! Welcome back to our TradingView treasure hunt. Today, we're cracking open one of the most magical tools in the trader's toolkit - the Fibonacci Retracement. Get ready to dive into this mystical world where numbers become your allies, helping you predict where the market might bounce or break next. Let's turn those chaotic market moves into patterns you can play with!
Fibonacci Retracement
One of the coolest, most revolutionary tools you'll encounter in trading is the Fibonacci Retracement. When you first see it, it's like a rainbow of lines, but at its core, it's all about the Golden Ratio, or the Fibonacci sequence, which is roughly 0.618. This isn't just math; it's a natural phenomenon that can guide your trading decisions.

Here are the Fibonacci levels you'll be working with:
0%
23.6%
38.2%
50%
61.8%
78.6%
100%
And don't forget the higher multiples like 161.8%, 261.8%, and so on. I like to keep my charts clean, so here's how I customize it:
Color: I go for a single, less intrusive gray.
Dots: I make them slimmer for better clarity.
Levels: I trim down the higher multiples to keep things uncluttered.
This tool is your secret weapon to spot where the price might dip for a breather before continuing its journey. Imagine drawing from the bottom to the top of an uptrend; those 50% and 61.8% levels can be key support zones where the price might just bounce back.
If the price starts to retrace after a significant upward move, you apply Fibonacci from the lowest to the highest point of that move. Watch how the price interacts with these levels. It often finds support around the 50% or 61.8% mark before moving up again.
This tool is versatile across different time frames and fundamental to my trading strategy.

Trend-based Fibonacci Extension
Now, let's talk about its sibling, the Trend-based Fibonacci Extension, which is like a crystal ball for spotting where a trend might peak or trough. Here's the magic formula:
After seeing a trend move in five waves (check out the purple wave in the chart), you'll use the extension from one high to the next. Start at the bottom, climb up to the first wave, and then back down to the base again (see the yellow pattern). This is how you draw this extension. It can show you where resistance might kick in, like at 261.8% or 361.8%, hinting at a reversal or sell-off.
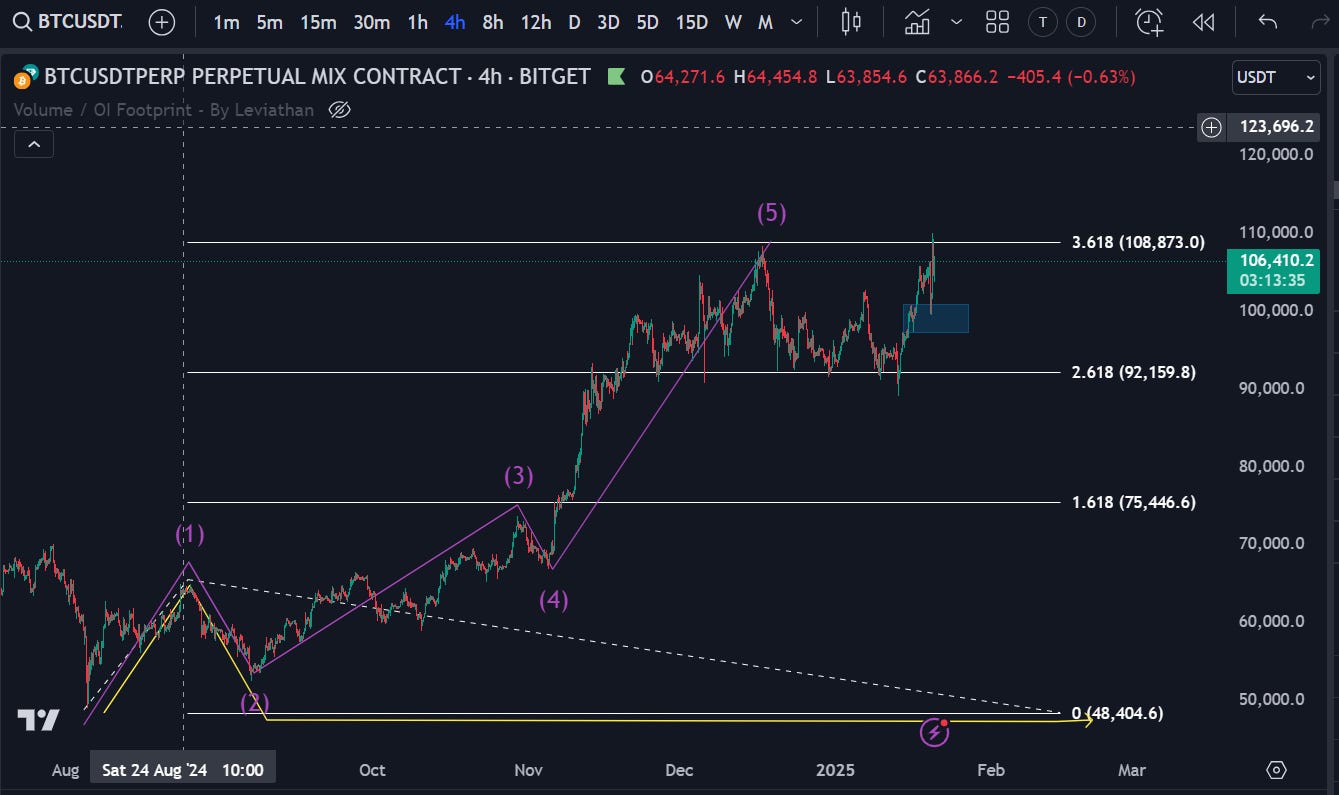
This method works just as well for downward trends, making your predictions sharper and your trading more effective.
Organize Drawings
To keep your chart looking like a work of art, TradingView has the 'Object Tree' feature. Here's how to keep your drawings in check:

Click on the layers icon in the right pane.
Select your drawings with Ctrl and click.
Name your group with the folder button.
Mute them for a cleaner view or show them off when needed.
Position Management
And when it comes to managing your trades, here's how to visualize your moves:

Set up your long or short positions right at those trend breaks, with clear entry, stop-loss, and take-profit levels. This way, you can see your risk-reward ratio right on the chart, tweaking your targets for the best outcome.

These tools and strategies provide a framework to master TradingView, helping you navigate and succeed in trading.
Swim with the Whales
Christo Columbus has shared with us his view on the current market conditions:
“As for my own positions, there are a few tokens underperforming. I'll be reviewing my portfolio this week and making adjustments where we've broken structure and could move lower. The goal is to de-risk weaker trades failing HTF resistance lines and rotate into stronger assets if a de-risking event unfolds. BTC moving into the 120 to 130k region is still a profit taking area for me and a time to rebalance a % back into cash.
For now, I’m sitting on my hands and watching the fireworks. Topping signals are flashing, but seasonally and based on the charts, there's still plenty of meat left on the bone. This is definitely the hardest Cycle I have ever been in and there are a lot of new factors to consider...
Stay sharp, and keep your eyes on the bigger picture! The next couple months is going to be the Wild Wild West out here...”
Watch how our Whale Room community turns these expert insights into real-world profits.
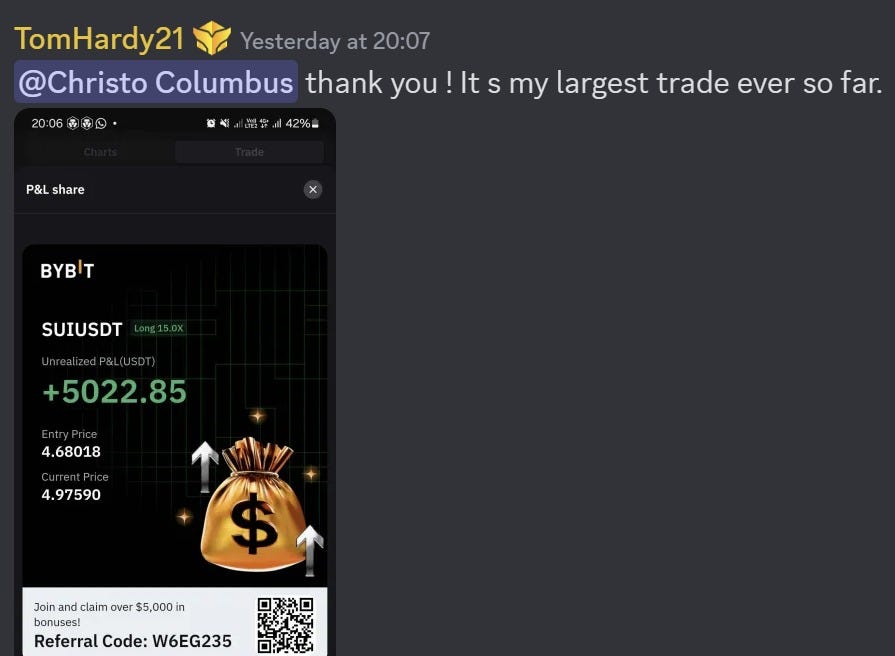
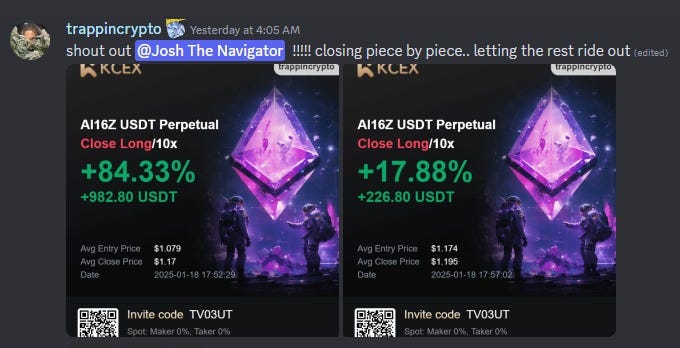
Are you ready to join the pod and swim with the whales?

Conclusion
There you have it, traders! With these Fibonacci tools, you're not just looking at charts; you're reading the market's next move like a pro. Keep practicing, keep customizing, and soon, you'll be the one setting the trends. Remember, TradingView isn't just a platform; it's your playground for trading magic.
Have you ever used the Fibonacci Retracement tool to catch a market reversal or continuation? Share your success story!"
Ready to swim with the big fish and turn those Fibonacci insights into real profits? Dive into the Whale Room where we share exclusive trading strategies and market secrets. Join now and let's make those charts sing to our tune!
Help Spread the Word!
If you’d like to help me spread the word, all you have to do is send one friend a personal email where you tell them all about today’s blog.
Follow Kyle on X: Kyle Doops
Watch Kyle’s YouTube channel: Kyle's YouTube
Follow our new Whale Room page on X: Whale Room X Page
Chat soon!
Your Whale Room Blogger